· AtlasPCB Engineering · Engineering · 17 min read
PCB Impedance Control Manufacturing Tolerances: A Fabricator's Guide to Tolerance Stack-Up, Process Control, and Common Failures
How manufacturing tolerances compound to shift PCB impedance beyond spec. Real stack-up math, process controls for ±10% to ±5%, common DFM failures, and cost trade-offs from a fabricator's production data.
Reviewed by AtlasPCB Engineering Team
Every impedance-controlled board begins with a target number. Fifty ohms single-ended, one hundred ohms differential, eighty-five ohms for a PCIe lane. Designers spend considerable effort calculating trace widths and dielectric heights to reach those targets, and rightly so. But the number on the schematic is only half the story. The other half — the half that determines whether ten thousand boards will all perform the same way — lives in the manufacturing tolerances that accumulate between the lamination press and the finished panel.
From our production floor, we have observed a pattern that repeats itself month after month. An engineer specifies a tight tolerance because the datasheet suggests it. The stackup looks perfect in simulation. Then first-article samples come back marginal, yield drops, and cost climbs. The root cause is almost never a single variable going out of range. It is the quiet compounding of several small variations, each within its own spec, adding up to an impedance shift that exceeds the budget. Understanding how that stack-up works — and how to manage it — is the single most valuable skill for anyone ordering impedance-controlled PCBs.
Why Impedance Tolerances Matter More Than Impedance Values
Getting the nominal impedance right is straightforward. Any competent field solver will calculate a trace geometry that produces 50 ohms on paper. The real engineering challenge is maintaining that value across an entire production run — panel after panel, lot after lot — while material batches shift, etch lines drift, and lamination conditions vary by a fraction of a percent.
Consider a 50-ohm microstrip trace referenced to an inner ground plane. A dielectric thickness that is 5% thinner than nominal lowers impedance by roughly 3 ohms. A trace etched 0.3 mil wider than target drops it another 1.5 ohms. Copper plated 3 microns thicker contributes another ohm. Individually, each of these variations is well within a manufacturer’s standard process window. Combined, they push the trace to approximately 45.5 ohms — a 9% deviation from target. Under a +/-10% tolerance that board passes. Under +/-5% it does not.
Signal integrity engineers know the consequences. At multi-gigabit data rates, a 5-ohm impedance discontinuity creates reflections that degrade eye diagrams, increase jitter, and raise bit error rates. In RF circuits operating above a few gigahertz, the same mismatch translates directly to return loss and power waste. The tolerance specification is not a paperwork exercise. It is the contract between your design intent and the physical reality of the board in your hands.
Need Tight Impedance Control?
AtlasPCB delivers impedance-controlled PCBs from +/-10% to +/-5% with full TDR test reports on every lot. Get engineering review and a quote in 24 hours.
Request a Free QuoteThe Five Variables That Control Your Impedance
Five manufacturing parameters determine the characteristic impedance of every trace on your board. Each carries its own tolerance band, and understanding the sensitivity of impedance to each one is essential for predicting where your production boards will land.
Dielectric thickness is the most sensitive single parameter. The distance from a signal trace to its reference plane has an approximately linear relationship with impedance for microstrip structures: a 10% change in dielectric height produces roughly a 5-7% change in impedance. Prepreg resin content, lamination pressure, and press temperature profiles all influence the final dielectric thickness. In a standard process, dielectric thickness is controlled to approximately +/-10%. For tight-tolerance impedance work, we tighten that to +/-5% or better through dedicated press programs and incoming material verification.
Trace width is the designer’s primary tuning variable but also the manufacturer’s most visible source of variation. Etching is an inherently imperfect process: the etchant attacks copper from the top and sides simultaneously, producing a trapezoidal cross-section rather than a perfect rectangle. The difference between the designed width and the actual bottom width after etching — the etch factor — varies with copper weight, etch chemistry, and line density. For outer layers with pattern plating, typical trace width tolerance runs +/-0.5 to 1.0 mil on a 5-mil trace, translating to roughly +/-10-20% on the narrowest geometries. Inner layers, which use print-and-etch without plating, are slightly more predictable but still subject to the same chemistry.
Copper thickness affects impedance through both the trace cross-section and the proximity of the conductor surface to the reference plane. Standard 1-oz copper (35 microns nominal) can vary by +/-5 microns across a panel after plating. That variation is small in absolute terms but not negligible — it shifts impedance by 1-2% on typical geometries and becomes more significant on thin traces where the height-to-width ratio is large.
Dielectric constant (Dk) determines how the electromagnetic field propagates between the trace and its reference plane. Standard FR-4 specifies Dk at approximately 4.2-4.5 at 1 GHz, but the actual value depends on resin content, glass weave style, frequency, and temperature. Dk tolerance on standard FR-4 runs +/-0.15 to 0.20, which corresponds to roughly +/-3-5% impedance variation. High-frequency laminates like Rogers RO4350B offer tighter Dk tolerance (+/-0.05), which is one reason designers choose them for impedance-critical applications even when the frequency itself would not demand it.
Solder mask is the variable most often overlooked. On outer-layer microstrip traces, the solder mask coating acts as a secondary dielectric, lowering the effective impedance by 2-5 ohms depending on coating thickness and the mask material’s own Dk value. Solder mask thickness varies from 15 to 35 microns across a panel, and that variation introduces impedance scatter. For the tightest tolerance work, we recommend either specifying solder mask thickness limits on impedance-critical traces or, where the design allows, removing mask from those traces entirely and relying on stripline routing on inner layers.
Tolerance Stack-Up: How Small Variations Compound Into Big Problems
Here is where most published guides stop: they list the variables, note that each one matters, and advise the designer to “work with your manufacturer.” That is unhelpful. What actually matters is the math of how these independent variations combine.
There are two ways to model tolerance stack-up. The worst-case method assumes every parameter shifts in the same direction simultaneously — dielectric gets thinner, trace gets wider, copper gets thicker, Dk increases, all at once. This produces the maximum possible impedance deviation and represents an extremely unlikely scenario. The root sum square (RSS) method assumes the variations are independent and normally distributed, producing a statistically realistic estimate of the expected deviation.
Let us work through a concrete example. Consider a 50-ohm microstrip on standard FR-4 with the following nominal parameters and typical manufacturing tolerances:
- Dielectric height: 4.0 mil nominal, +/-0.4 mil (+/-10%) — impedance sensitivity: approximately 5% impedance change per 10% dielectric change
- Trace width: 7.0 mil nominal, +/-0.7 mil (+/-10%) — impedance sensitivity: approximately 4% impedance change per 10% width change
- Copper thickness: 1.4 mil nominal, +/-0.14 mil (+/-10%) — impedance sensitivity: approximately 1.5% impedance change per 10% thickness change
- Dk: 4.2 nominal, +/-0.2 (+/-4.8%) — impedance sensitivity: approximately 2.5% impedance change per 5% Dk change
Worst-case stack-up: 5% + 4% + 1.5% + 2.4% = 12.9% total impedance variation. This exceeds +/-10% tolerance.
RSS stack-up: sqrt(5^2 + 4^2 + 1.5^2 + 2.4^2) = sqrt(25 + 16 + 2.25 + 5.76) = sqrt(49.01) = 7.0% total impedance variation.
The RSS result of +/-7% is comfortably within a +/-10% specification but already exceeds +/-5%. This is precisely why achieving +/-5% impedance tolerance with standard FR-4 and standard process controls is so difficult — the statistical stack-up of normal manufacturing variation nearly consumes the entire budget before any single parameter goes out of spec.
This calculation explains a phenomenon we see regularly in production: all individual process parameters are within their specified ranges, yet the finished board’s impedance falls outside the customer’s tolerance. The variables conspired, not because anything went wrong, but because statistics works exactly as the math predicts.
What Changes When You Tighten From +/-10% to +/-5%
Moving from +/-10% to +/-5% impedance tolerance is not simply a matter of measuring more carefully. It requires fundamental changes in how we control every stage of fabrication. Understanding what those changes entail helps explain the cost difference and helps designers decide when the tighter tolerance is genuinely necessary.
At +/-10% tolerance, standard manufacturing processes are sufficient. We apply etch compensation based on historical data for the copper weight and line width range, use standard prepreg layup sequences, and verify impedance with sample TDR measurements on test coupons. Material batches are accepted within the supplier’s standard Dk tolerance window. This is the workhorse tolerance for the vast majority of controlled impedance designs, covering applications from USB 2.0 through DDR4 and most industrial Ethernet interfaces.
At +/-7% tolerance, we begin to tighten individual process windows. Material batches are screened for Dk consistency, with tighter incoming inspection limits. Lamination press profiles are optimized per stackup rather than using generic programs. Etch compensation moves from lookup tables to per-panel calculations based on the specific copper weight and panel density. TDR testing frequency increases from statistical sampling to higher coverage, and we track impedance trends using statistical process control (SPC) charts to catch drift before it becomes a yield problem.
At +/-5% tolerance, nearly every parameter requires dedicated control. We lock specific prepreg suppliers and resin systems for the duration of a production campaign. Lamination uses dedicated press programs with real-time thickness monitoring. Etch compensation algorithms account for panel-specific copper distribution using automated optical inspection (AOI) feedback. Copper plating uniformity is controlled to +/-3 microns through optimized current density and anode configuration. Solder mask thickness on impedance-critical traces is constrained to a narrow window, typically 15-20 microns, with separate spray or curtain-coat passes if necessary. TDR testing covers every coupon on every panel, and measurement uncertainty itself becomes a factor — probe calibration, ambient temperature, and operator technique must all be controlled to prevent measurement variation from consuming the tolerance budget.
The yield impact is real. A process that delivers 98% yield at +/-10% may drop to 90-92% at +/-5% on the same design, and the fallout cost is passed through to the customer. This is not a failing of the manufacturer — it is the physics of stacking multiple variables within a narrow window.
From Prototype to Volume Production
Whether you need +/-10% standard tolerance or +/-5% tight control, AtlasPCB provides impedance simulation during quoting and TDR verification on every production lot.
Request a Free QuoteCommon Impedance Failures We See in Customer Designs
Having reviewed thousands of impedance-controlled designs over the years, we see the same failure patterns recurring. These are not exotic edge cases — they account for the majority of impedance-related DFM flags we raise during pre-production review. For a complete pre-order verification process, see our guide on DFM checks for impedance-controlled boards.
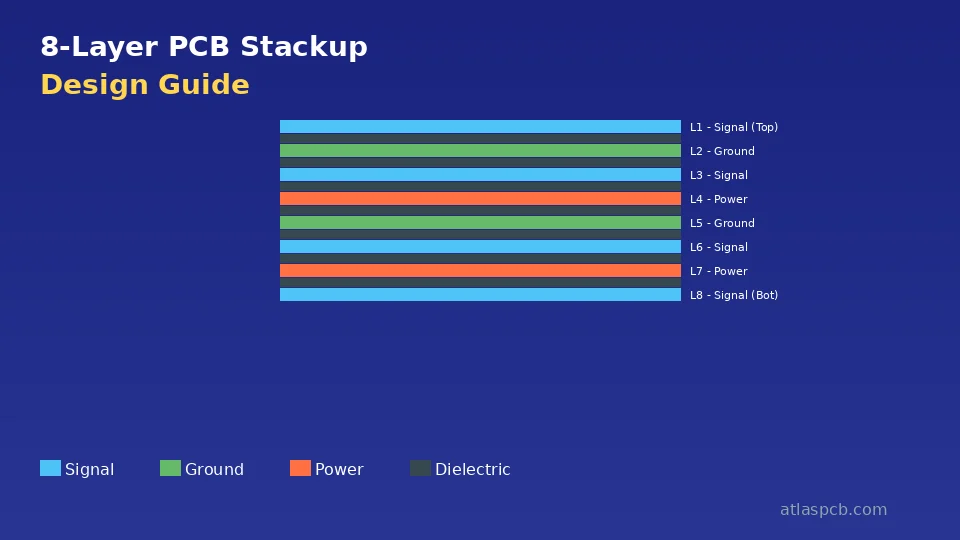
Narrow traces on thick dielectric. A designer targets 50 ohms and calculates a 3.5-mil trace on a 5-mil dielectric. Mathematically correct, but a 3.5-mil trace has almost no manufacturing margin. A +/-0.5 mil etch variation represents +/-14% of the trace width. The resulting impedance scatter will be wide regardless of how well the rest of the process is controlled. The fix is often to reduce the dielectric height (by choosing a thinner prepreg) so that a wider trace achieves the same impedance. We routinely recommend this trade during our controlled impedance stackup design review — a 5.5-mil trace on a 3.5-mil dielectric produces the same 50 ohms with far better manufacturing robustness.
Missing reference plane under impedance traces. Impedance exists only relative to a reference conductor. When routing transitions from one layer to another through a via, the reference plane may change — and if there is a gap in the reference plane (due to a split or a clearance hole), the impedance at that point is undefined and typically spikes. We see this in designs where the ground plane has been carved up for isolation purposes or where power plane clearances leave impedance traces without a nearby return path.
Ignoring solder mask effects on outer-layer impedance. Many designers simulate their impedance as bare microstrip, without accounting for the 2-4 ohm impedance reduction caused by solder mask. When the board arrives from fabrication, the TDR reads low, and the designer assumes the manufacturer made an error. In reality, the design simulation was incomplete. We always simulate with solder mask unless the designer explicitly specifies mask relief on impedance traces.
Specifying +/-5% tolerance on geometries that cannot support it. Some designs request +/-5% tolerance on differential pairs with 3-mil trace width and 4-mil spacing. The manufacturing sensitivity of such fine geometries means that achieving +/-5% would require near-perfect process control on every variable simultaneously. We will quote it, but we will also flag it and recommend either relaxing the tolerance or widening the geometry. In many cases, the interface (USB 3.2, PCIe Gen4) functions perfectly well at +/-7% or even +/-10%.
Glass Weave Effects and Their Impact on Impedance Consistency
One of the most underappreciated sources of impedance variation is the glass reinforcement in FR-4 and other woven-glass laminates. The dielectric constant of the resin system is different from the dielectric constant of the glass fiber, and because the fibers are woven in a pattern, the local Dk value depends on whether a trace runs over a fiber bundle or over a resin-rich pocket between bundles.
This fiber weave effect creates localized impedance variations that standard cross-section measurements do not capture. For a narrow trace running parallel to the glass weave at the pitch of the fiber bundles, the impedance can vary by 2-3 ohms over a distance of just a few millimeters. This is not a defect — it is an inherent property of woven-glass construction.
The practical impact depends on the glass style used in the prepreg. Open-weave styles like 106 and 1080 have large resin-rich windows between fiber bundles, producing the greatest Dk non-uniformity. Tighter weave styles like 2116 and 7628 reduce the variation. Spread-glass or flat-glass variants, where the fiber bundles are mechanically flattened before weaving, further improve Dk uniformity and are the preferred choice for designs requiring tight impedance tolerance at high data rates.
From a manufacturing standpoint, we recommend spread-glass prepregs for any design with differential pairs operating above 10 Gbps or single-ended impedance tolerance of +/-5% or tighter. The material cost premium is modest — typically 10-15% over standard glass — and the improvement in impedance consistency across the panel is significant.
Reading Your Impedance Test Report: What TDR Data Really Tells You
When you receive an impedance-controlled board, the manufacturer includes a TDR (Time Domain Reflectometry) test report showing measured impedance values from test coupons on the production panel. Understanding what this report means — and what it does not mean — is essential for quality verification.
The test coupons are small trace structures placed in the panel border, designed to replicate the impedance-critical geometries in your design. Each coupon is measured using a TDR instrument that sends a fast electrical pulse down the trace and measures the reflected signal to determine impedance at every point along the trace length. The result is an impedance profile, typically reported as a nominal value and a range (minimum to maximum) across the coupon length.
What the coupon tells you is that the manufacturing process produced the correct impedance for that specific trace geometry on that specific panel. What it does not tell you is the impedance of every trace in your actual circuit, because your circuit traces may run through different areas of the panel with slightly different etch conditions, different proximity to copper pours, or different solder mask coverage.
Measurement uncertainty is also a factor. A well-calibrated TDR system in a controlled environment has a measurement uncertainty of approximately +/-1 to 1.5 ohms. On a 50-ohm trace with +/-5% tolerance (47.5 to 52.5 ohms), that measurement uncertainty consumes 40-60% of the tolerance window. This is why some manufacturers add a measurement guard band — they target a tighter internal process limit (say +/-3.5%) to ensure that measurement uncertainty does not push reported values outside the customer’s specified tolerance.
When reviewing your test report, look for consistency across multiple coupons on the same panel and across panels in the same lot. A systematic offset (all coupons reading 2 ohms high, for example) suggests a process shift that can be corrected. Random scatter across coupons suggests a less controlled process.
Every Board Ships With TDR Data
AtlasPCB includes impedance test reports with every controlled-impedance order -- standard tolerance and tight tolerance alike. Upload your design for engineering review.
Request a Free QuoteCost vs. Tolerance: Making the Right Engineering Trade-Off
Impedance tolerance directly drives manufacturing cost. The relationship is not linear — it is exponential as tolerances tighten. Based on our production data, the cost premium over a standard (non-impedance-controlled) board of the same layer count and complexity follows this approximate pattern:
A +/-10% controlled impedance specification adds roughly 15-20% to the base board price. This covers the cost of impedance simulation during CAM, etch compensation, TDR test coupons, and sample-based impedance verification.
Moving to +/-7% adds 25-35% over the base price. The incremental cost comes from tighter incoming material control, adjusted lamination programs, increased TDR testing coverage, and slightly lower yield.
At +/-5%, the premium rises to 40-60% or more, depending on the specific geometry and material. The cost includes dedicated material batches, per-panel process adjustment, comprehensive TDR testing, tighter solder mask control, and yield fallout. For a detailed breakdown of these cost factors, see our impedance-controlled PCB cost analysis.
The engineering decision should be driven by the application, not by caution. Most digital interfaces — USB 2.0/3.0, HDMI 1.4/2.0, DDR4, Gigabit Ethernet — function reliably at +/-10% impedance tolerance. High-speed SerDes at 25 Gbps and above, automotive radar, and precision RF front-ends genuinely benefit from +/-7% or tighter. The +/-5% specification should be reserved for applications where signal integrity simulations demonstrate that the link margin cannot tolerate wider impedance variation — typically 56+ Gbps PAM4 interfaces, mmWave circuits above 24 GHz, or mission-critical aerospace and medical systems.
Specifying tighter tolerance than necessary does not improve performance. It only increases cost and lead time. A well-designed stackup with appropriate trace geometries and proper reference planes will deliver excellent signal integrity at +/-10% for the vast majority of applications.
Practical Recommendations for Designers
Based on our manufacturing experience, here are the guidelines that consistently produce the best results for impedance-controlled designs:
Use the widest trace geometry that your impedance target and routing density allow. Every additional mil of trace width reduces the percentage impact of etch variation. If your stackup allows a 6-mil trace instead of a 4-mil trace for the same impedance target, take the wider option.
Specify your impedance requirements clearly in the fabrication drawing. Include target impedance, tolerance, trace layer, reference layer, and whether solder mask is included in the simulation. Ambiguity in the specification is the single largest source of impedance discrepancies between what the designer expected and what the manufacturer delivered.
Choose your tolerance based on the interface requirements, not on a blanket assumption. Different nets on the same board can have different tolerance requirements. It is perfectly acceptable — and cost-effective — to specify +/-10% for most signals and +/-7% only for the high-speed lanes that need it.
Work with your manufacturer during stackup design, not after it is finalized. We routinely adjust prepreg selections, copper weights, and layer assignments to improve impedance manufacturability without changing the designer’s electrical intent. That collaboration happens during quoting, and it costs nothing.
Ready for Your Project?
AtlasPCB delivers precision impedance-controlled PCBs with documented test reports. Get a quote in 24 hours.
Request a Free QuoteAbout AtlasPCB — We specialize in complex PCB manufacturing for HDI, RF, and high-reliability applications. Explore our impedance-controlled PCB manufacturing, or get an free engineering DFM review . Every order includes free engineering review. Get your quote.
Reviewed by AtlasPCB Engineering Team — IPC-certified manufacturing specialists with 15+ years of production experience in HDI, RF, and high-reliability PCB fabrication. Content based on factory floor data and real customer design reviews.
- impedance control
- manufacturing tolerances
- signal integrity
- DFM
- TDR testing
- PCB stackup
- controlled impedance
- process control